
Customer Intelligence & Retention
Customer Intelligence & Retention · 2026년 7월 19일 · 8 분 읽기
In most consumer businesses, twenty percent of the customer base produces sixty to eighty percent of the revenue. That twenty percent is often the segment analytics notices least — they do not open every email, they do not respond to promotions, and their departure is only visible in the aggregate after it has already happened.
Every enterprise marketing team has a version of the same conversation once a quarter. The retention rate looks acceptable, the aggregate revenue is roughly on plan, the promotional campaigns are hitting their reported response rates. And somewhere in the quiet parts of the customer base, a small group of high-value customers whose behavior nobody was watching closely enough has silently degraded, and the compounded effect will show up as a revenue miss three quarters from now.
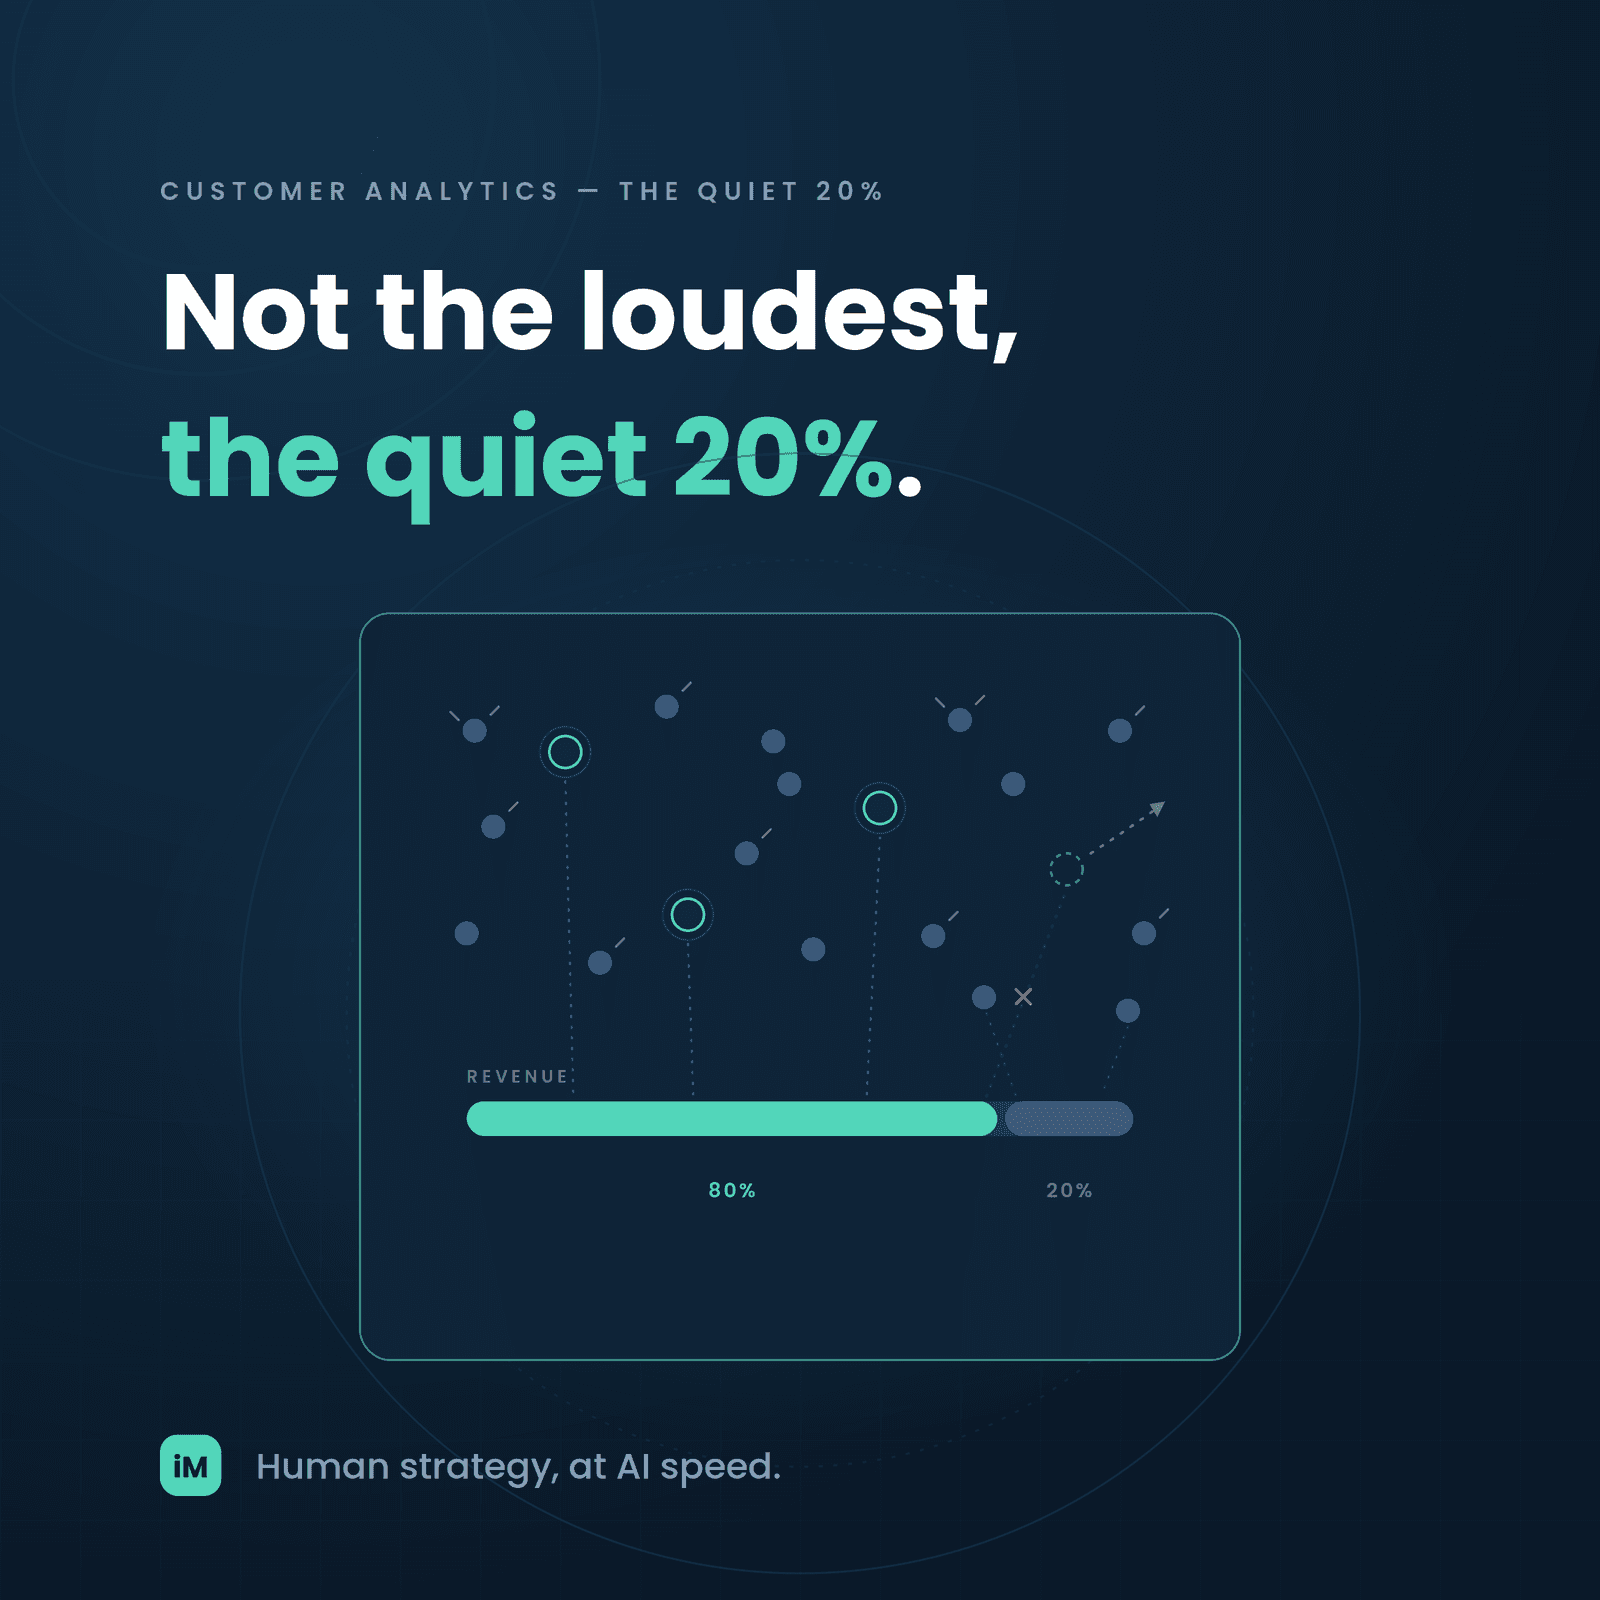
The uncomfortable truth is that in most consumer businesses, the twenty percent of customers who produce sixty to eighty percent of the revenue is often the segment analytics notices least. They do not open every promotional email — they do not need to. They do not respond to activation campaigns — they are already activated. They do not show up in the win-back reports — they never lapsed enough to trigger the sequence. They are the customers the marketing operation is most dependent on and least aware of, and their quiet departure is the specific mechanism by which supposedly healthy businesses miss the number.
This piece walks through why the high-value segment is invisible to standard reporting, what the specific early-warning signals look like, and what changes when the marketing operation starts watching the twenty percent with the same attention the aggregate rate gets.
The high-value segment is invisible for three specific structural reasons. The first is that standard reporting is built around response metrics — email opens, promotion redemptions, campaign clickthroughs — and the highest-value customers are the ones who need the fewest prompts. They convert on organic intent, not on promotional trigger, and their absence from the response reports reads as low engagement when it is actually the opposite.
The second reason is the aggregate-rate framing. Retention rate, engagement rate, average order value — all reported as aggregates that dilute the twenty percent's signal into the eighty percent's noise. A high-value customer's frequency dropping from 12 purchases per year to 9 is a serious signal that gets averaged into the aggregate frequency of a base where most customers purchase 3-4 times a year. The aggregate does not move, and the specific degradation is invisible.
The third reason is the tenure bias in retention reporting. The lapsed-customer segment is usually defined by absolute time since last purchase — 60 days, 90 days, 180 days. But a Loyalist who purchased weekly and now has not purchased for 45 days has already Slipped by a large margin, while a Casual who purchased quarterly and last purchased 80 days ago is still within their normal rhythm. Absolute-time definitions capture the Casual as lapsed and miss the Loyalist entirely.
The 80/20 rule is not a slogan in consumer marketing — it is the actual arithmetic of most bases. Twenty percent of customers producing eighty percent of revenue is the median shape, and the ratio is often more extreme. Fifteen percent producing seventy percent, or ten percent producing sixty percent, is common in categories with high-value repeat customers.
The operational implication is that the marketing operation is spending resources roughly evenly across the base — email volumes, promotional spend, service investment — while the revenue is coming disproportionately from a narrow segment. The mismatch means the twenty percent is getting the same treatment as the eighty percent, and the twenty percent's specific needs — recognition, differentiation, relationship depth — are being served by a general program that was designed for the majority count, not the majority revenue.
The compound effect is that the twenty percent's satisfaction gradually erodes. Not from any single event — the marketing operation is not being negligent, and the customer service is not failing — but from a slow accumulation of undifferentiated treatment. The Loyalist reclassifies to Casual, the Casual to Slipping, and the marketing team notices only when the aggregate retention rate finally moves. By then the specific customers have decided, and the recovery window is closed.
The early-warning signals in the high-value segment are subtle, but they are readable if the reporting is set up to expose them individually. A Loyalist who purchases weekly does not need to lapse for 30 days for the signal to fire. A gap of 14 days when the historical average is 7 is already a two-standard-deviation event that a well-scored system flags.
The signals are not new information — the data is already in the system. The change is exposing them individually, per customer, in a view that the retention team actually reads.
The first change is that the Loyalist-to-Slipping transition becomes visible in the moment it happens rather than in the quarter after. A specific Loyalist whose frequency compressed by two standard deviations three weeks ago is a specific target for a specific intervention — not a generic 'we miss you' email, but a diagnostic outreach that reads the specific pattern and matches the response.
The second change is that the loyalty program becomes appropriately weighted. The twenty percent gets recognition and service that reflects their revenue share, not the average treatment calibrated to the base count. The differentiation is not about deeper discounts — often the opposite, since high-value customers do not need discounts — but about earlier access, service-level differentiation, and the recognition that the relationship is being seen.
The third change is that the acquisition strategy sharpens. Look-alike modeling built on the twenty percent — not on the aggregate customer base — produces a materially different prospect list. The prospects who resemble Loyalists are the specific ones worth the higher CAC that acquiring them requires, and the LTV projection on those prospects justifies the spend in a way that averages-based CAC math cannot.
The specific reporting change that has to land is the high-value-segment view — a report that shows the twenty percent's retention, revenue, and engagement trajectories separately from the aggregate. The aggregate report stays for the board slide, but the operational report is the segmented view.
The segmented report exposes what the aggregate hides. If the twenty percent's retention rate is trending down while the aggregate is flat, the marketing team knows exactly where to intervene. If the twenty percent's basket is narrowing, the specific categories that are losing share become visible. If the twenty percent's engagement is drifting on email but holding on organic visits, the channel-specific intervention becomes obvious.
The report is not more numbers — it is the same numbers segmented in a way that makes the twenty percent readable. That single change moves the retention operation from reactive to leading, because the signals in the high-value segment show up weeks before they aggregate into the visible report.
The customers producing seventy percent of the revenue are the ones the standard reports notice last. By the time the aggregate retention rate finally moves, the specific Loyalists have already decided and the recovery window is closed.
Making the twenty percent visible does not require a new analytics stack. It requires scoring every customer on value contribution, defining the high-value segment by score band rather than by absolute revenue threshold, and building the operational report that exposes the segment's trajectories separately. The first-month goal is the high-value segment report and one early-warning intervention rule — not a full personalization deployment.
inMOLA's Customer Score module identifies the twenty percent automatically, tracks each Loyalist's individual trajectory against their own historical baseline, and fires early-warning signals in the moment the pattern shifts. The specific Loyalists whose frequency compressed, whose basket narrowed, or whose engagement drifted become visible in the same view where the intervention is authored, weeks before the aggregate retention report would surface the pattern.
The twenty percent is not going to leave loudly. They are going to leave quietly, one at a time, while the aggregate reports say the base is healthy. The marketing programs that finally watch the specific Loyalists rather than the aggregate mean will spend the next four quarters keeping the customers the description-only programs are silently losing.
Customer Intelligence & Retention
Customer Intelligence & Retention

Customer Intelligence & Retention