
Customer Intelligence & Retention
Customer Intelligence & Retention · 15 juillet 2026 · 8 min de lecture
Average basket size, average frequency, average retention — the numbers every marketing team defends in the quarterly review describe a customer who is not actually in the base. The distribution the averages hide is where the revenue and the risk both live.
Every marketing team's quarterly review runs on the same handful of numbers. Average basket size. Average purchase frequency. Average customer lifetime. Average retention rate. The numbers get compared to last quarter, the direction of change is celebrated or defended, and the meeting moves on with a shared feeling that the business has been measured.
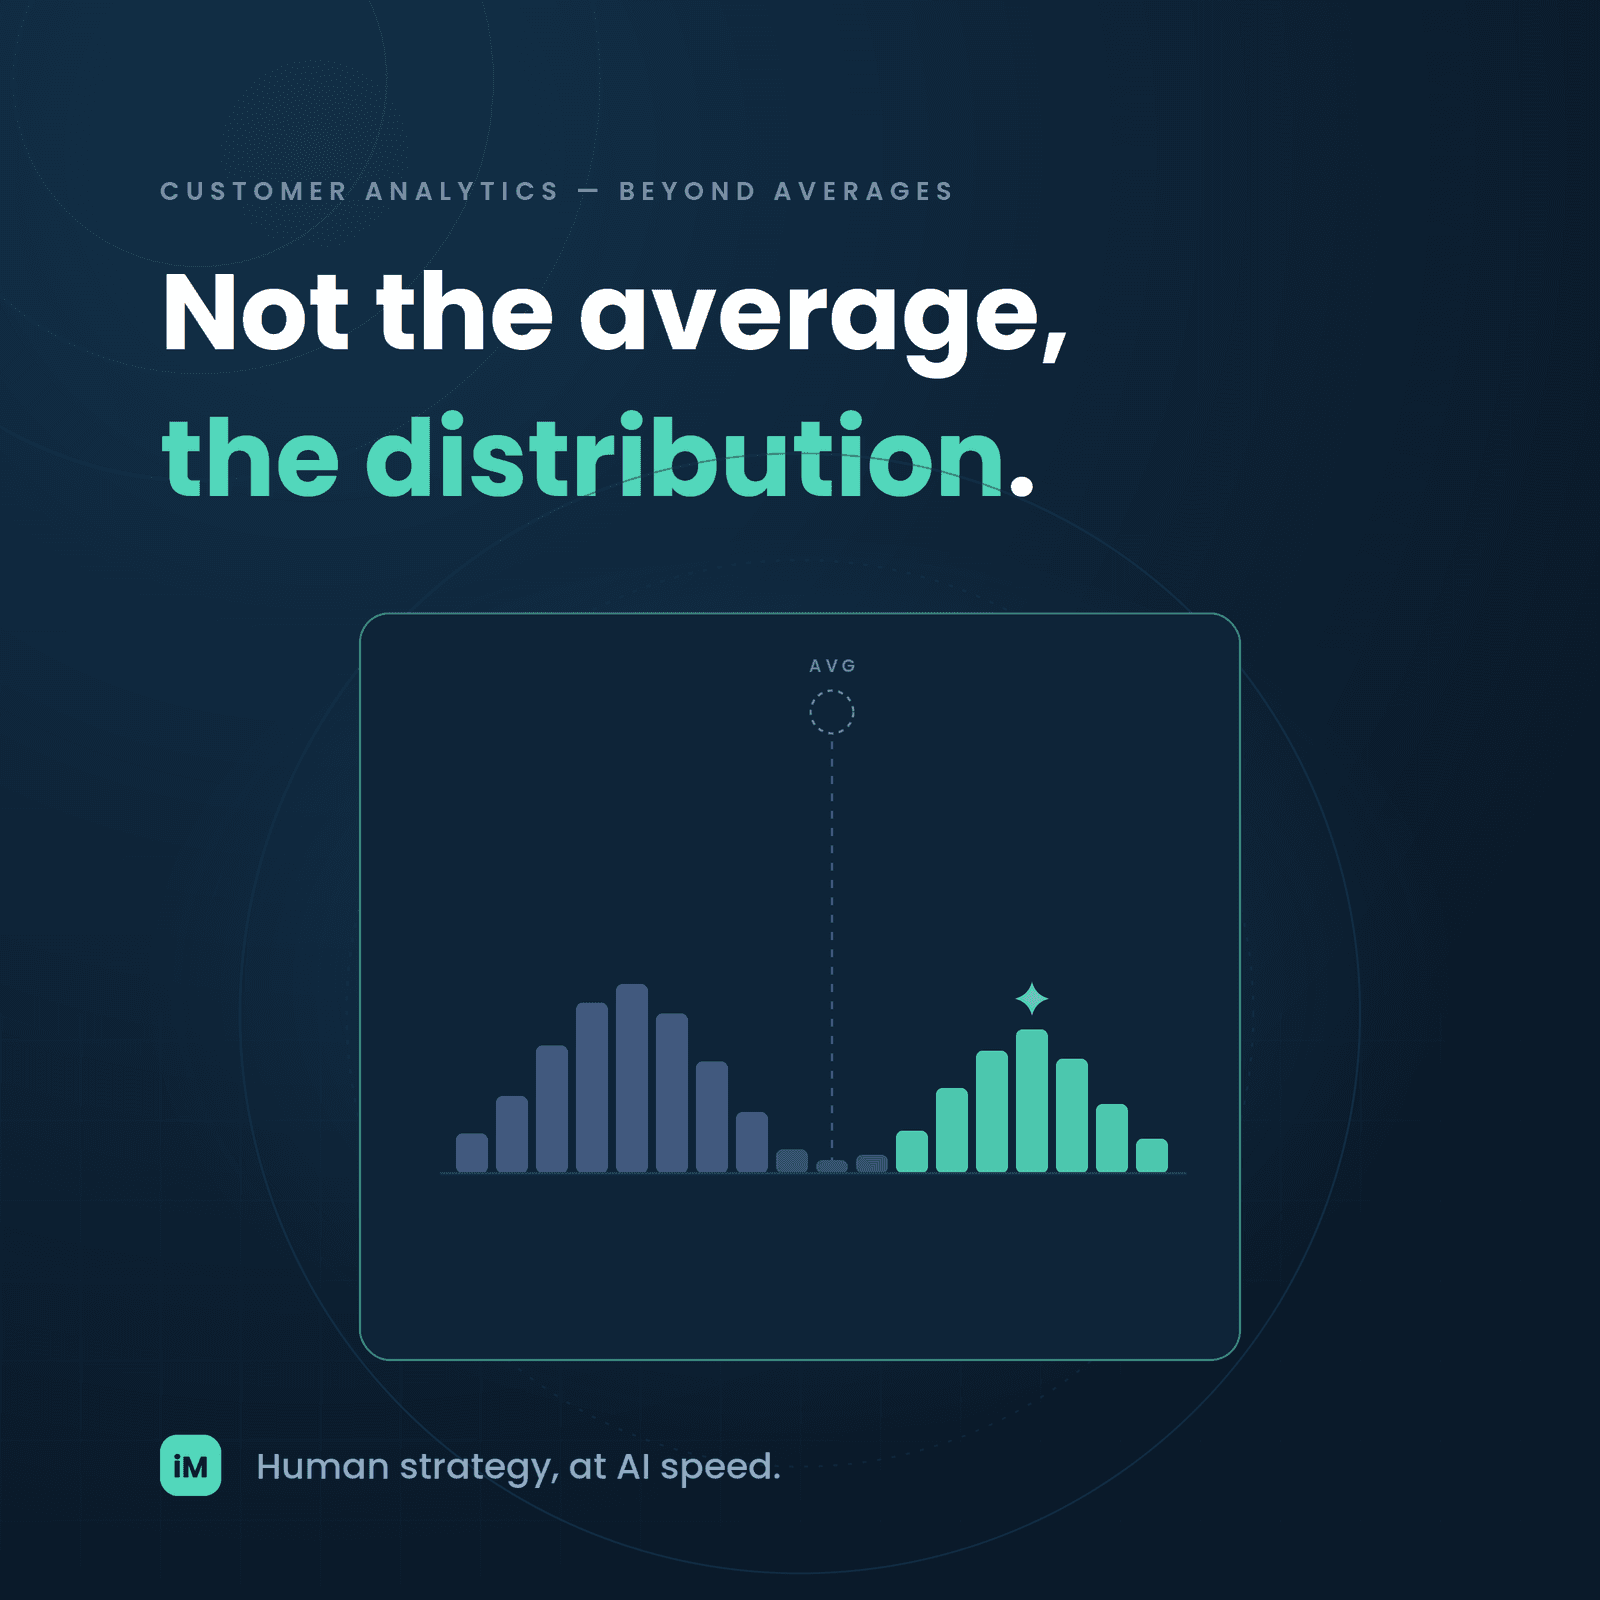
The uncomfortable truth is that none of those averages describe a customer who is actually in the base. They describe a statistical artifact — the mean of a distribution — that in most consumer businesses corresponds to no real buyer. The average basket size might be $85, but the actual customers are split between $30 purchasers and $200 purchasers, and the $85 average tells you nothing about either group. Marketing decisions optimized against the $85 number miss both.
This piece walks through why the average-customer framing survived so long, what specifically breaks when a business runs on it, and what changes when the marketing team stops arguing about the mean and starts operating on the distribution.
The average-customer framing survived for two reasons. The first is measurement convenience — averages are what analytics tools have always produced, because a single number per metric is what fits on a slide, in a report, in a KPI dashboard. The individual distribution is harder to visualize and harder to communicate to a room, so the average becomes the metric of record by default.
The second reason is the illusion of representativeness. The mean feels like it should represent the typical customer, and 'the typical customer' feels like the right unit to plan against. The mental shortcut is intuitive and wrong. In a distribution where the customers cluster at the extremes and thin out in the middle — which is the shape of most consumer bases — the mean lands in the sparse middle where almost no one actually sits.
The framing survived until three things changed at once. Individual-level data became cheap enough to store at scale. Compute became cheap enough to score every customer individually rather than in aggregate buckets. And the competitive gap between averages-based marketing and individual-based marketing became large enough that the businesses running on averages started losing measurable share to the ones running on individuals.
The first thing that breaks is the loyalty program. A loyalty program designed against the average customer — average frequency, average basket, average retention — delivers rewards that are meaningful to almost no one. The high-frequency customers who carry most of the revenue find the rewards too small to matter; the low-frequency customers find the thresholds too high to reach. The program pays out to the middle of the distribution where the fewest customers actually live.
The second thing that breaks is retention marketing. A generic 'we miss you' email campaign fired at everyone whose last purchase was more than 60 days ago hits three very different populations at once. It hits the loyal customer who happens to be between purchases and feels vaguely insulted by being treated as a lapsed shopper. It hits the genuinely lapsing customer who could be recovered with the right offer but gets a generic discount that undervalues the specific relationship. And it hits the customer who has already made a permanent decision to leave and treats the email as spam. The one-message campaign to the 60-day segment averages across all three and works well on none.
The third thing that breaks is acquisition targeting. Look-alike modeling built on the average existing customer produces prospect lists that resemble the mean, which is the wrong target. The prospects worth acquiring are the ones who will become the high-value customers at the top of the distribution, not the ones who resemble the middle. Averages-based look-alikes systematically produce mediocre prospects at the cost per acquisition of premium prospects, and the CAC:LTV ratio stays stuck exactly where the finance team hoped it would move.
The specific shape of most consumer customer distributions is bimodal or Pareto — a small population of high-value customers producing the majority of revenue, a large population of low-value customers producing the majority of the count, and a thin middle. The average sits in the thin middle, which is why it feels intuitive and why it fails operationally.
The Pareto version is the more common shape. Twenty percent of customers producing eighty percent of revenue is not a metaphor in most consumer businesses — it is the actual arithmetic. The remaining eighty percent of customers produce the remaining twenty percent, but they do so at a much higher marketing cost per dollar because the acquisition and retention spend is spread evenly across the base rather than concentrated on the twenty percent who justify it.
The bimodal version is the shape that emerges in businesses with two distinct customer archetypes — a professional buyer and a consumer buyer, a subscription customer and a one-time buyer, a domestic customer and an export customer. The average of two distinct populations is a fictional customer who does not exist in either. Every marketing decision made against that average is optimized for the fiction.
The individual view replaces the average with a per-customer score. Every buyer in the base gets a single, defensible score that captures where they sit in the distribution — how valuable they are, how engaged they are, whether they are trending up or down, and what specific action would move them. The score is not a static label; it is a living number that updates as behavior changes.
The immediate operational change is that segments become score-defined rather than average-defined. Instead of a 'lapsed customer' segment defined as 'anyone who has not purchased in 60 days,' the segment becomes 'customers whose score has dropped from Loyalist to Slipping in the last 30 days.' The definition is behavioral rather than temporal, and it produces a much more targeted intervention set.
The second operational change is that the loyalty program can be designed against the actual distribution. The high-value tier serves the twenty percent who produce the majority of revenue. The mid-tier serves the customers with the potential to become high-value. The entry tier serves the customers who need activation. The program pays out where the value is, and the ROI moves accordingly.
The specific reporting change that has to happen for the shift to land is the segmented revenue view. Instead of one line for aggregate revenue, the report shows revenue by customer score band — how much of last quarter's revenue came from Loyalists, from Casuals, from Slipping customers who almost churned, from Departing customers who did not come back. The composition becomes visible, and the composition is what the marketing team actually manages.
The report is not new information — the data was already in the system. The change is presentation: the composition is visible in a way that the aggregate number never made visible, and the marketing conversation shifts to which composition line needs attention this quarter.
The average customer is a statistical fiction the business defends until the quarter it stops working. The distribution has been telling a different story the whole time.
Moving off the average-customer framing does not require replacing the CRM or the analytics stack. It requires scoring every customer individually, defining segments by score band rather than by activity thresholds, and reporting revenue by band composition rather than by aggregate mean. The first-month goal is one segmented revenue view and one score-based retention rule, not a full personalization deployment.
inMOLA's Customer Score module scores every buyer in the base on a continuously updated basis and exposes the distribution the aggregate numbers hide. Every customer's band, trajectory, and estimated lifetime value is visible individually. Segments are score-defined, retention campaigns fire against behavioral signals, and the loyalty program rewards the customers whose value actually justifies it.
The average-customer framing did not survive because it was correct. It survived because measuring the individual was expensive and the tooling was not ready. Both of those constraints are gone, and the marketing programs that finally read the distribution will spend the next four quarters compounding a share advantage over the ones still defending the mean.
Customer Intelligence & Retention

Customer Intelligence & Retention
Customer Intelligence & Retention