


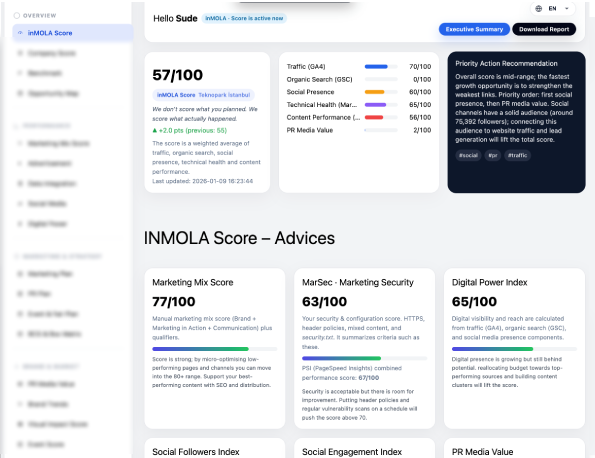
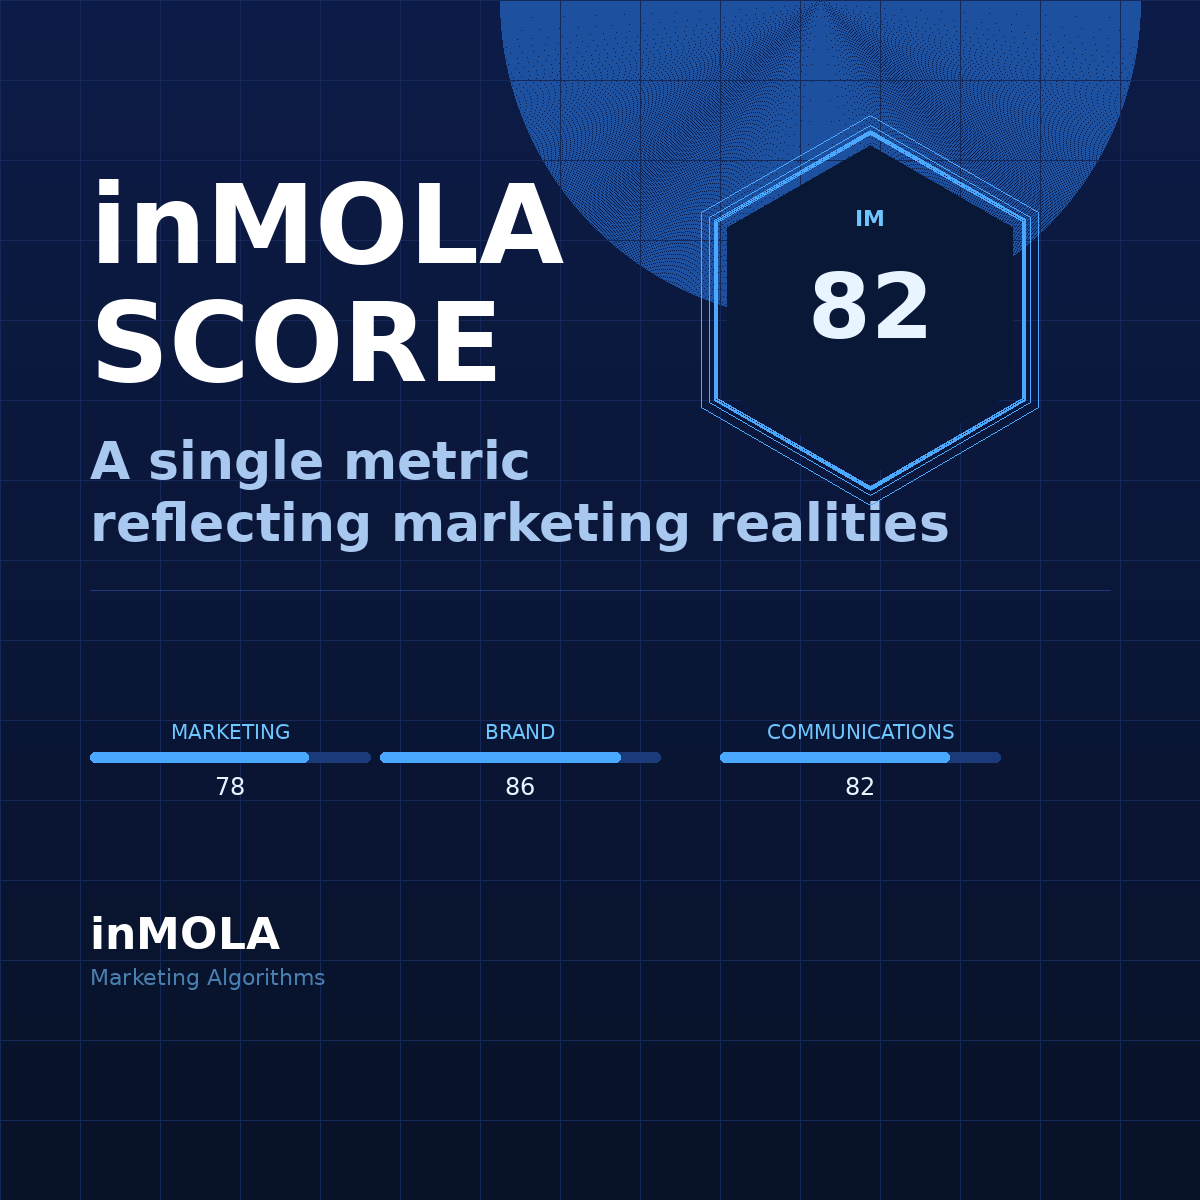

inMOLA Score
InMOLA Score consolidates your entire digital, marketing, and PR performance into a single, objective metric. It brings together traffic, organic search, social presence, technical health, content effectiveness, and digital PR impact to reflect the real state of your brand’s marketing power.
Beyond showing where you stand today, InMOLA Score tracks momentum, growth patterns, and early risk signals. By combining performance data with trend analysis, it helps teams understand not only what is happening, but what is likely to happen next — enabling faster, smarter, and more proactive decisions.
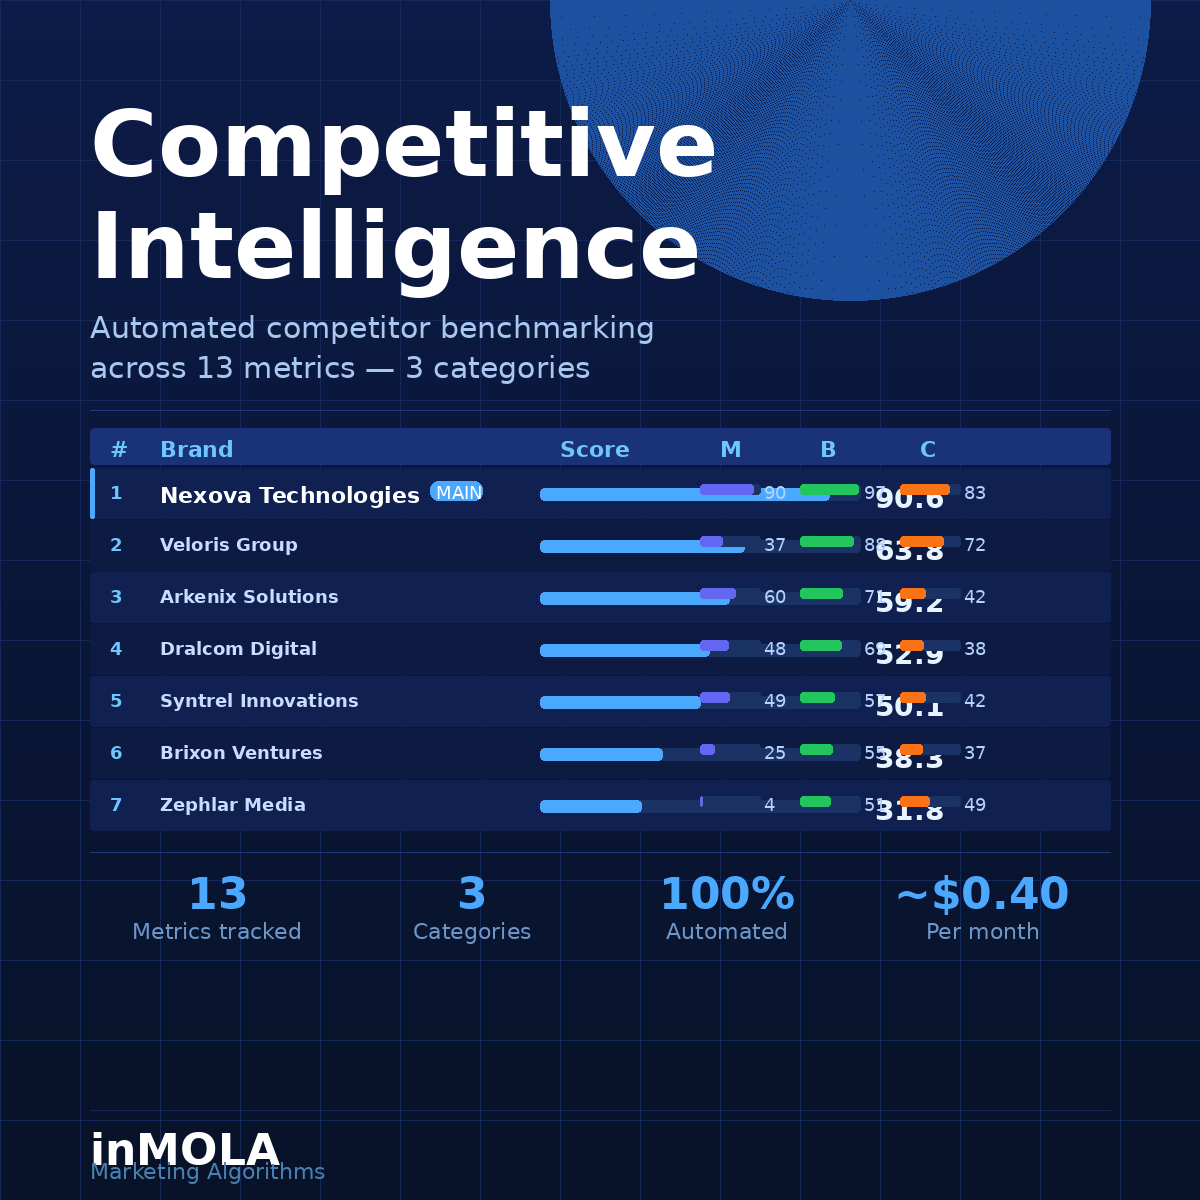
Competitive Intelligence
Competitive Intelligence gives you a complete, automated view of how your brand stacks up against your competitors — no manual research, no guesswork. It tracks 13 key metrics across three core categories: Marketing performance, Brand strength, and Communications reach. Every metric is normalized against the highest value in your competitor group, so you always know exactly where you stand.
Updated on demand or on a scheduled basis, the module captures a fresh snapshot each time — enabling you to track momentum shifts, spot emerging threats, and identify the gaps your competitors haven't closed yet. With automated scoring, delta badges showing month-over-month changes, and a detailed breakdown for each brand, Competitive Intelligence turns market complexity into clear, actionable decisions.
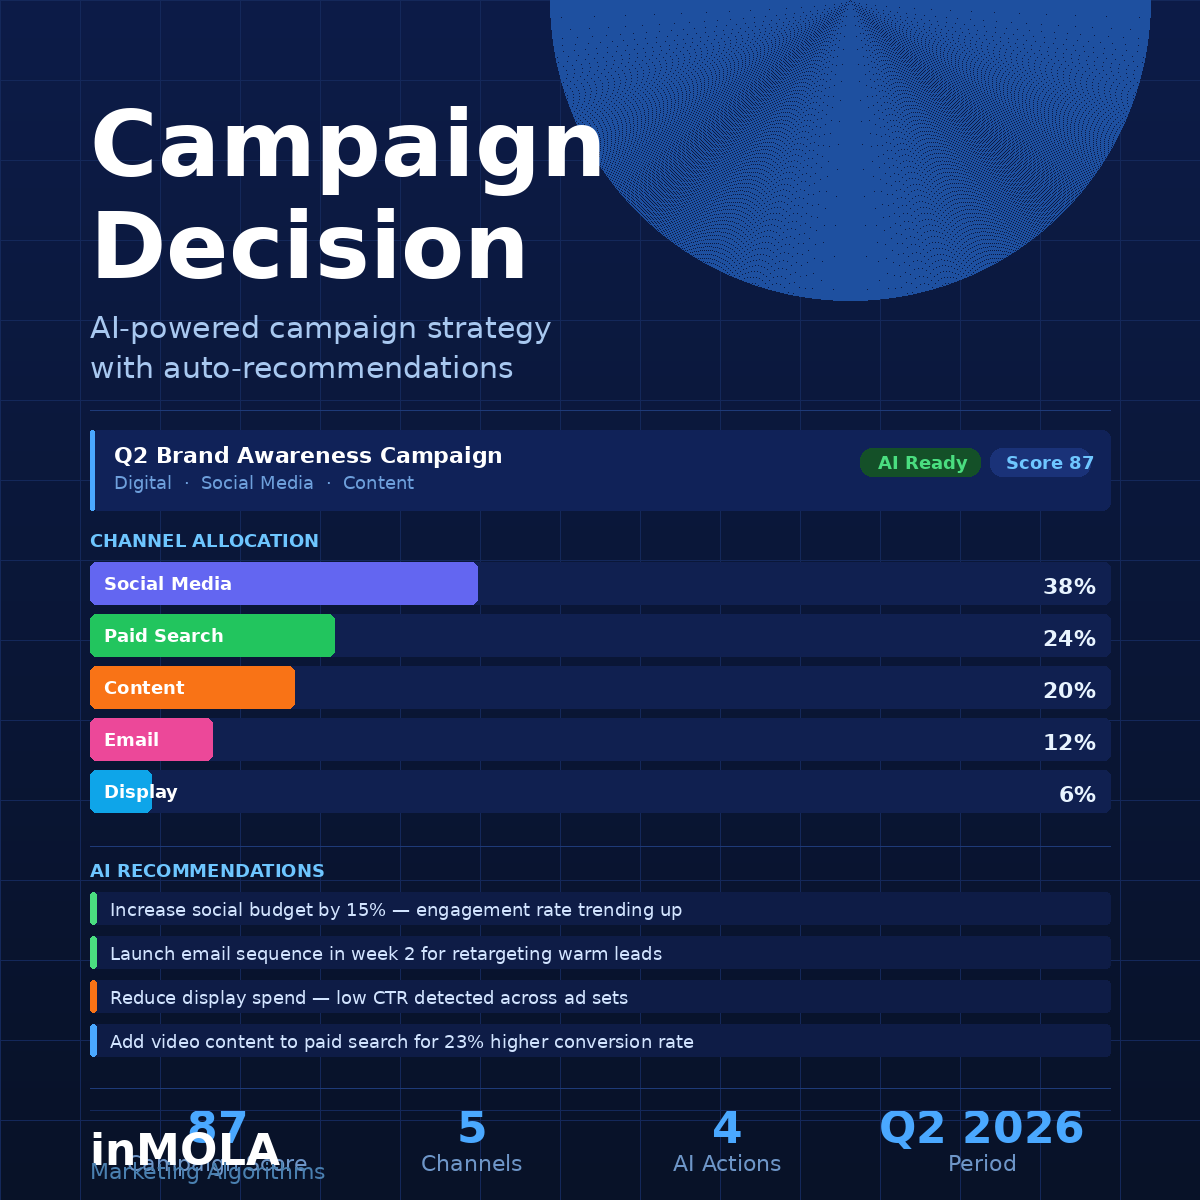
Campaign Decision
Campaign Decision is inMOLA's AI-powered campaign strategy engine — built for marketing teams that need more than dashboards. It analyzes your current channel performance, audience signals, and historical campaign data to generate a complete campaign blueprint with automated budget allocation recommendations across Social Media, Paid Search, Content, Email, and Display. Every decision is backed by data, not instinct.
Beyond planning, Campaign Decision actively monitors your campaign as it runs — flagging underperforming channels, identifying high-conversion opportunities, and surfacing AI-generated action items in real time. Whether you're launching a new product or optimizing an existing campaign, it tells you exactly where to invest, where to pull back, and what to test next — so your team always moves with confidence.
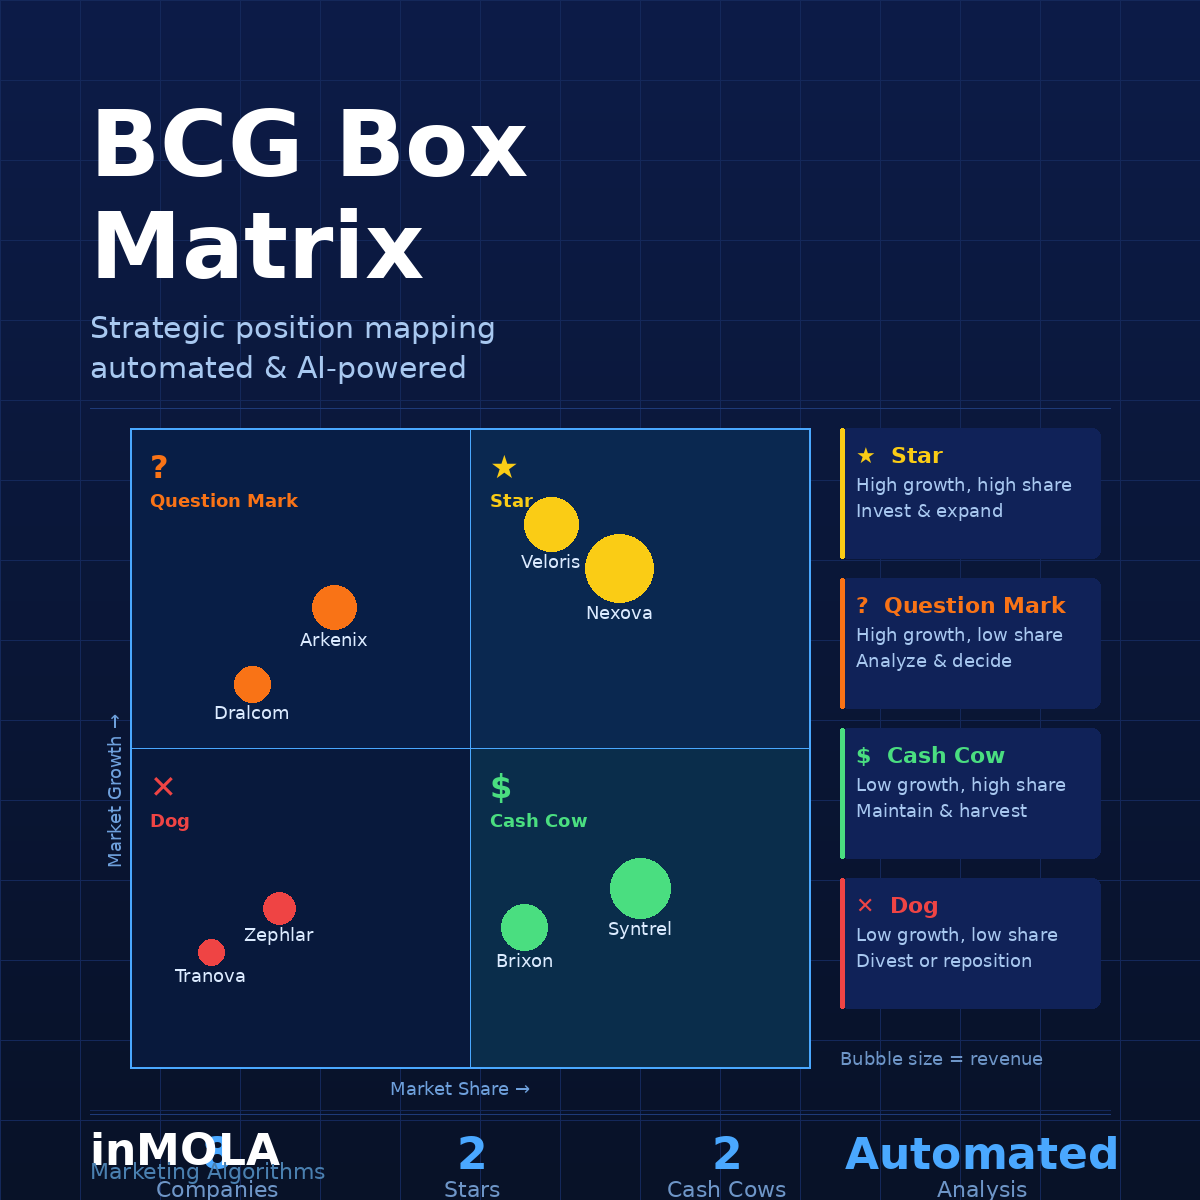
BCG Box Matrix
InMOLA BCG Box Matrix is an advanced strategic decision framework that positions products, business units, or marketing channels based on performance, momentum, and future opportunity, rather than relying solely on traditional market share and growth metrics. Instead of offering a static snapshot, it reveals which areas should be scaled, optimised, repositioned, or deprioritised to drive sustainable growth.
Unlike the classic BCG matrix, the InMOLA approach integrates InMOLA Score, Company Score, PR Media Value, traffic, engagement, and growth trends into a single strategic view. This allows leaders to clearly distinguish between areas that look strong but are stagnating and those that may appear small yet show strong acceleration — enabling investment decisions driven by data-backed strategic prioritisation rather than intuition.
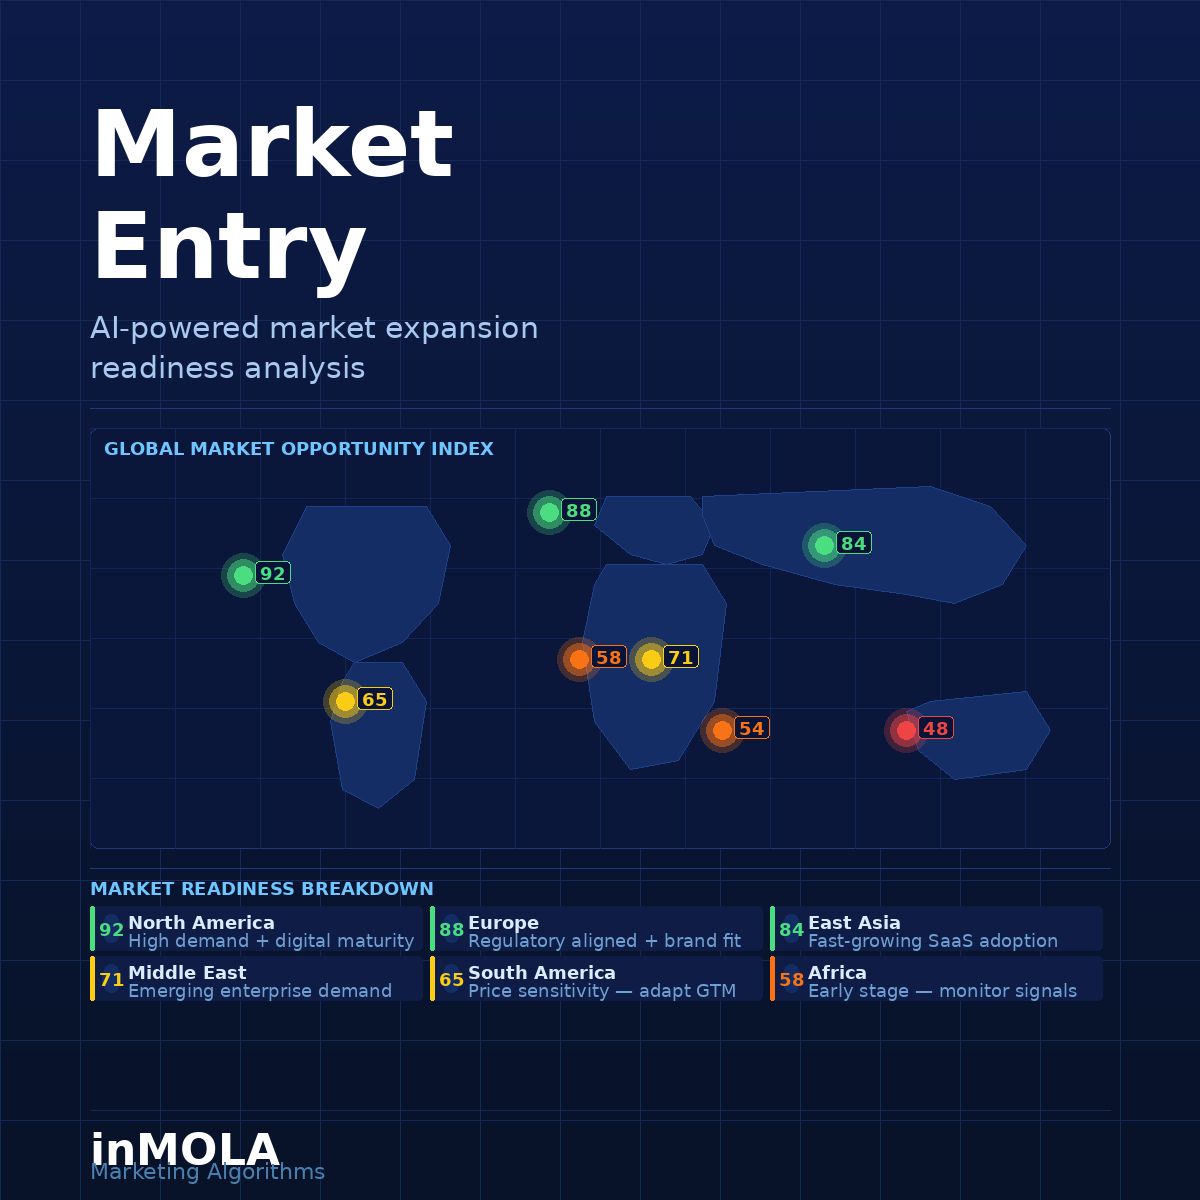
Market Entry
Market Entry takes the guesswork out of international expansion. Powered by AI, it evaluates your brand's readiness to enter new markets by analyzing demand signals, competitive density, digital maturity, and audience fit across regions — delivering a scored readiness index for each market so you can prioritize with confidence. Whether you're considering North America, Europe, Southeast Asia, or emerging markets, Market Entry gives you the data-backed clarity to make the right move at the right time.
Updated continuously and benchmarked against real market signals, the module goes beyond surface-level research. It surfaces region-specific opportunities, flags potential barriers to entry, and provides strategic guidance tailored to your brand's current position. Instead of commissioning a costly strategy consulting engagement, your team gets enterprise-grade market intelligence — automated, always current, and built directly into your marketing workflow.


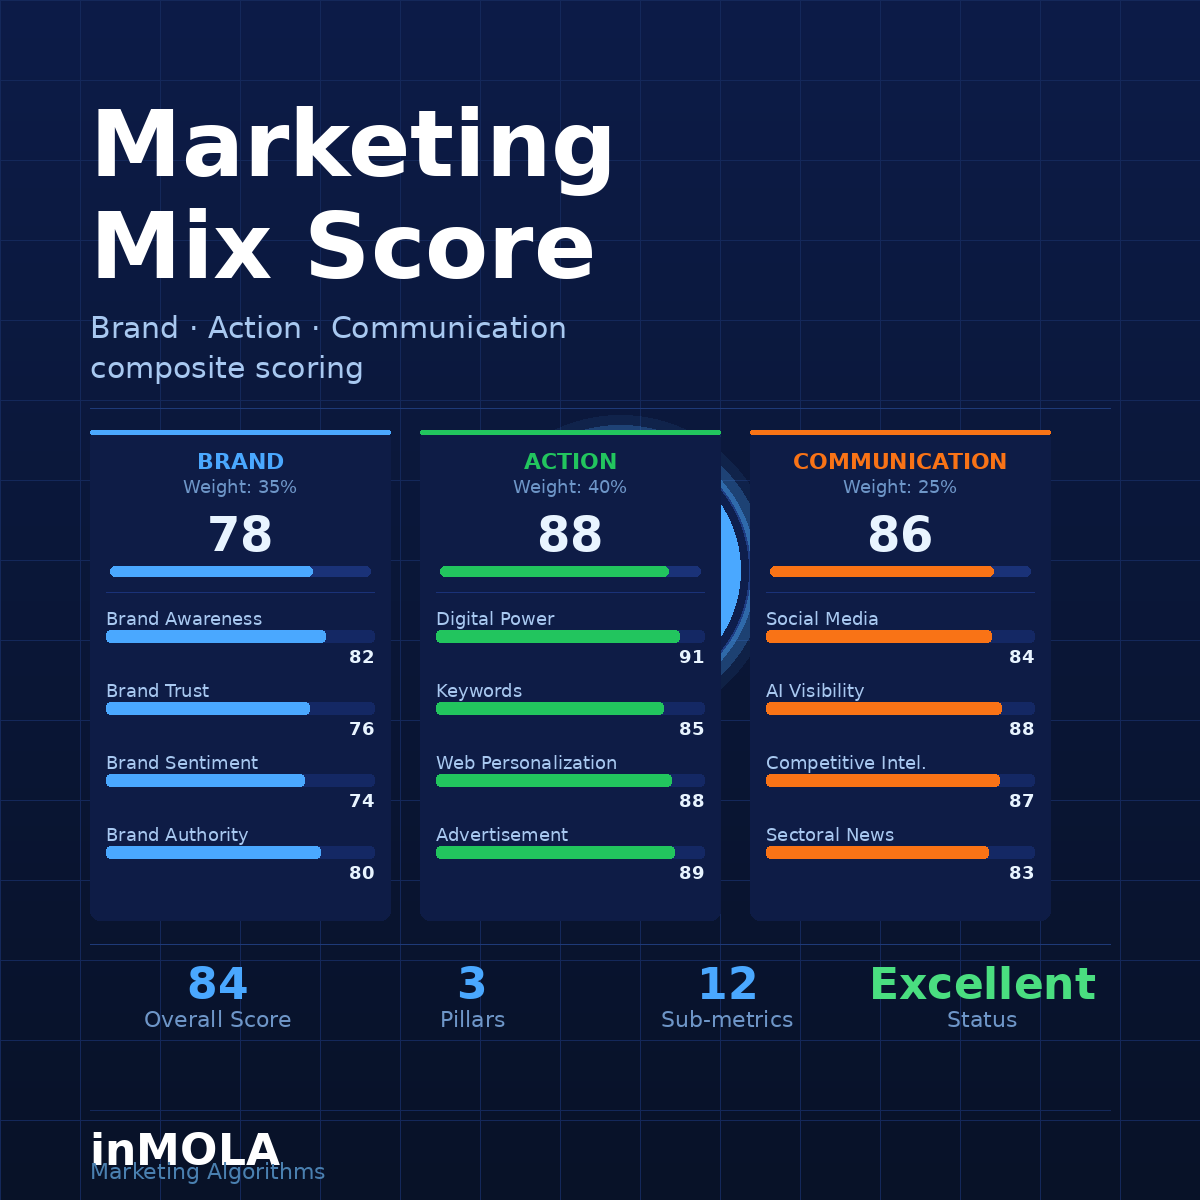
Marketing Mix Score
Marketing Mix Score evaluates how effectively your marketing strategy is designed, balanced, and executed across brand, communication, and activation layers. It measures the harmony between channels, consistency of messaging, budget allocation logic, execution discipline, and strategic alignment — turning complex marketing structures into a clear, actionable score.
Unlike pure performance metrics, Marketing Mix Score focuses on how marketing is built and managed. By revealing structural gaps, over- or under-invested channels, and execution mismatches, it helps teams optimise the mix itself — ensuring that every marketing action works together to drive sustainable, long-term impact.
A/B Test Tracker
A/B Test Tracker gives your marketing team the statistical confidence to make decisions that actually move the needle. Instead of relying on gut feel or inconclusive data, it tracks your experiments across key conversion points — from homepage CTAs and pricing page layouts to email subject lines and landing page copy — measuring visitor behavior, conversion rates, and engagement in real time across both variants.
Once a test reaches statistical significance, A/B Test Tracker automatically flags the winner and surfaces the performance lift, so your team knows exactly which direction to scale. With a built-in 95% confidence threshold, historical test archives, and AI-generated recommendations for your next experiment, it creates a continuous optimization loop — turning every page, email, and campaign into an opportunity to perform better than yesterday.
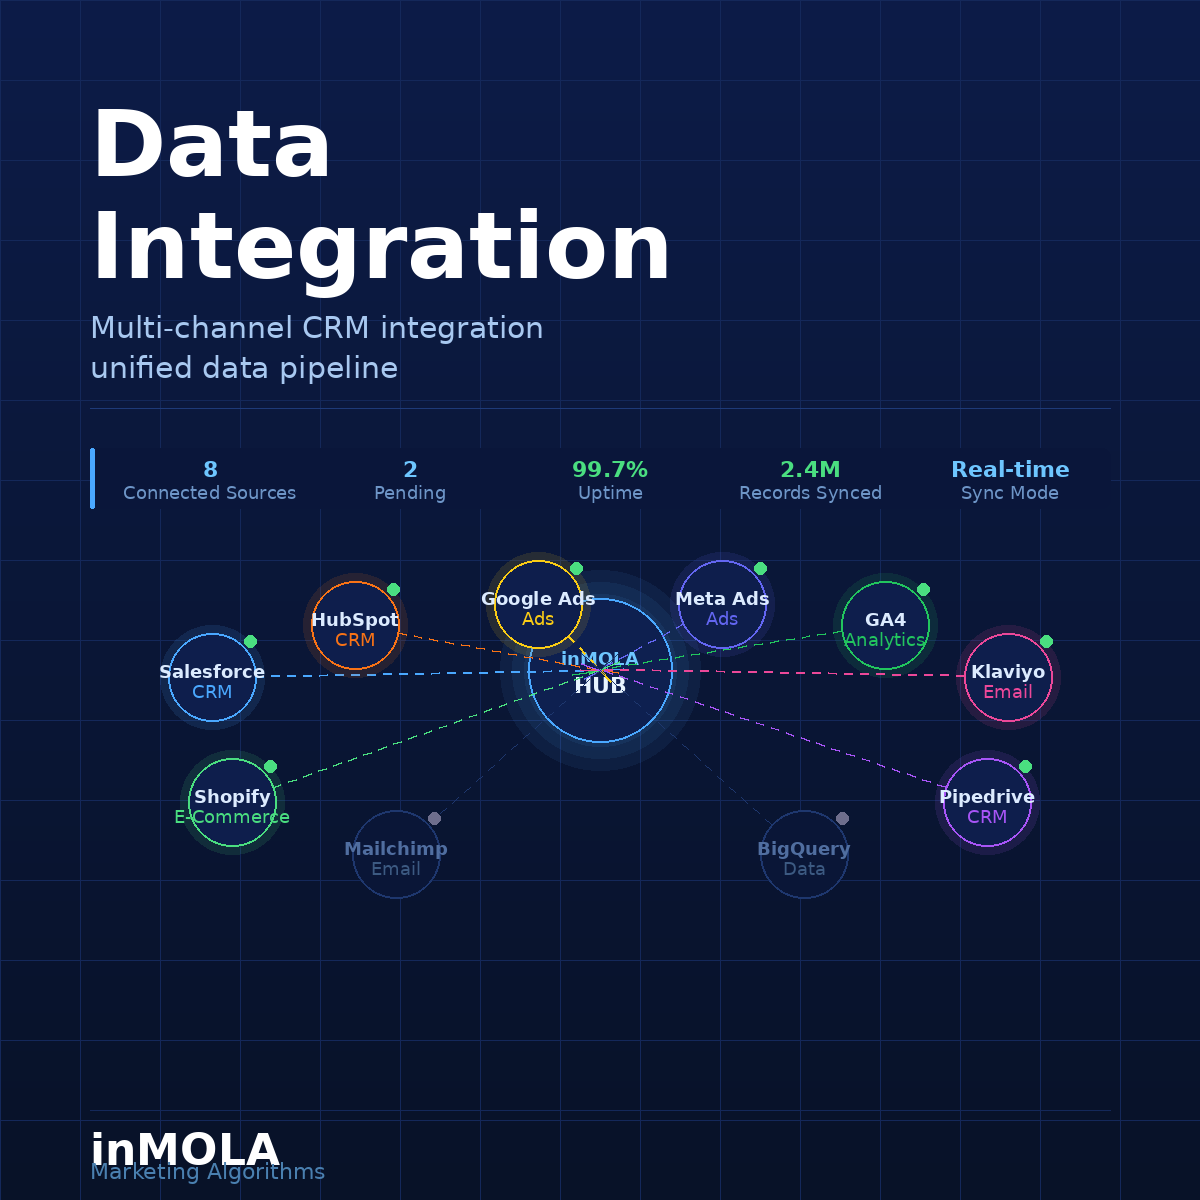
Data Integration
Data Integration is the backbone of InMOLA’s intelligence layer, unifying data from multiple platforms into a single, consistent structure. It connects analytics, social media, advertising, SEO, PR, and technical data sources to eliminate silos and ensure that every insight is based on a complete and reliable picture.
By standardising and synchronising data in real time, the Data Integration tool enables accurate scoring, meaningful comparisons, and trustworthy trend analysis. This foundation allows all InMOLA tools to work together seamlessly — turning raw data into coherent, decision-ready intelligence.
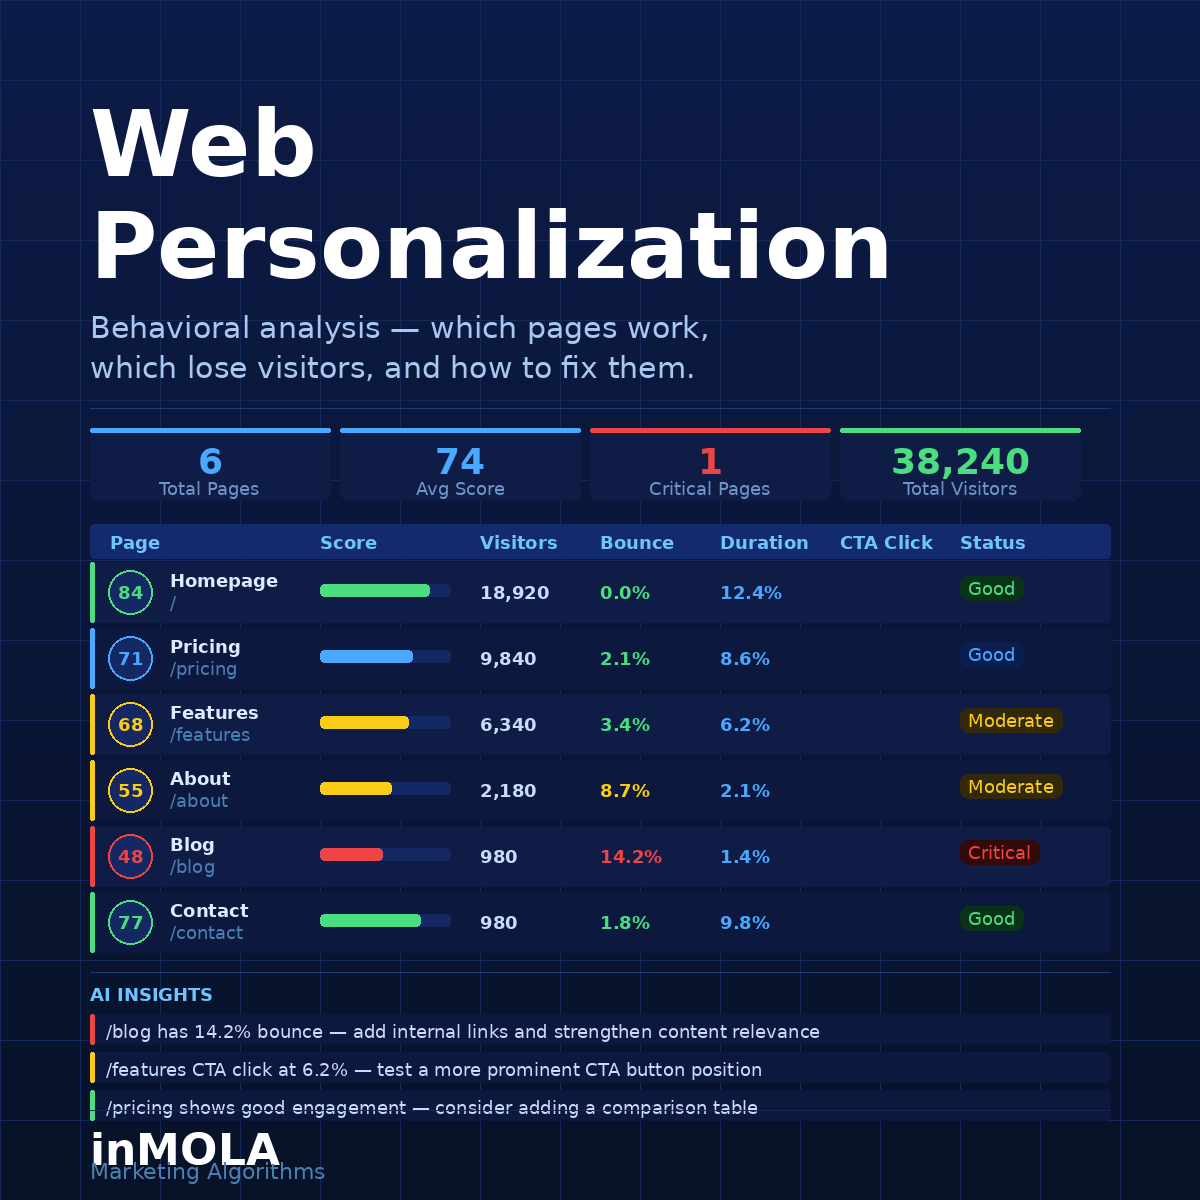
Web Personalization
Web Personalization gives you a page-by-page breakdown of how visitors actually experience your website — what's working, what's driving them away, and exactly what needs to change. By combining behavioral data with AI analysis, it scores each page across key performance dimensions including traffic sources, bounce rate, session duration, conversion rate, and CTA engagement. Every page gets a clear score and status, so your team always knows where to focus first.
Beyond the metrics, Web Personalization delivers AI-generated recommendations tailored to each page — from CTA placement and form optimization to content structure and value proposition clarity. Whether a page is underperforming or already converting well, the module continuously surfaces opportunities to improve, test, and grow. The result is a smarter website that adapts to your audience rather than waiting for them to adapt to it.
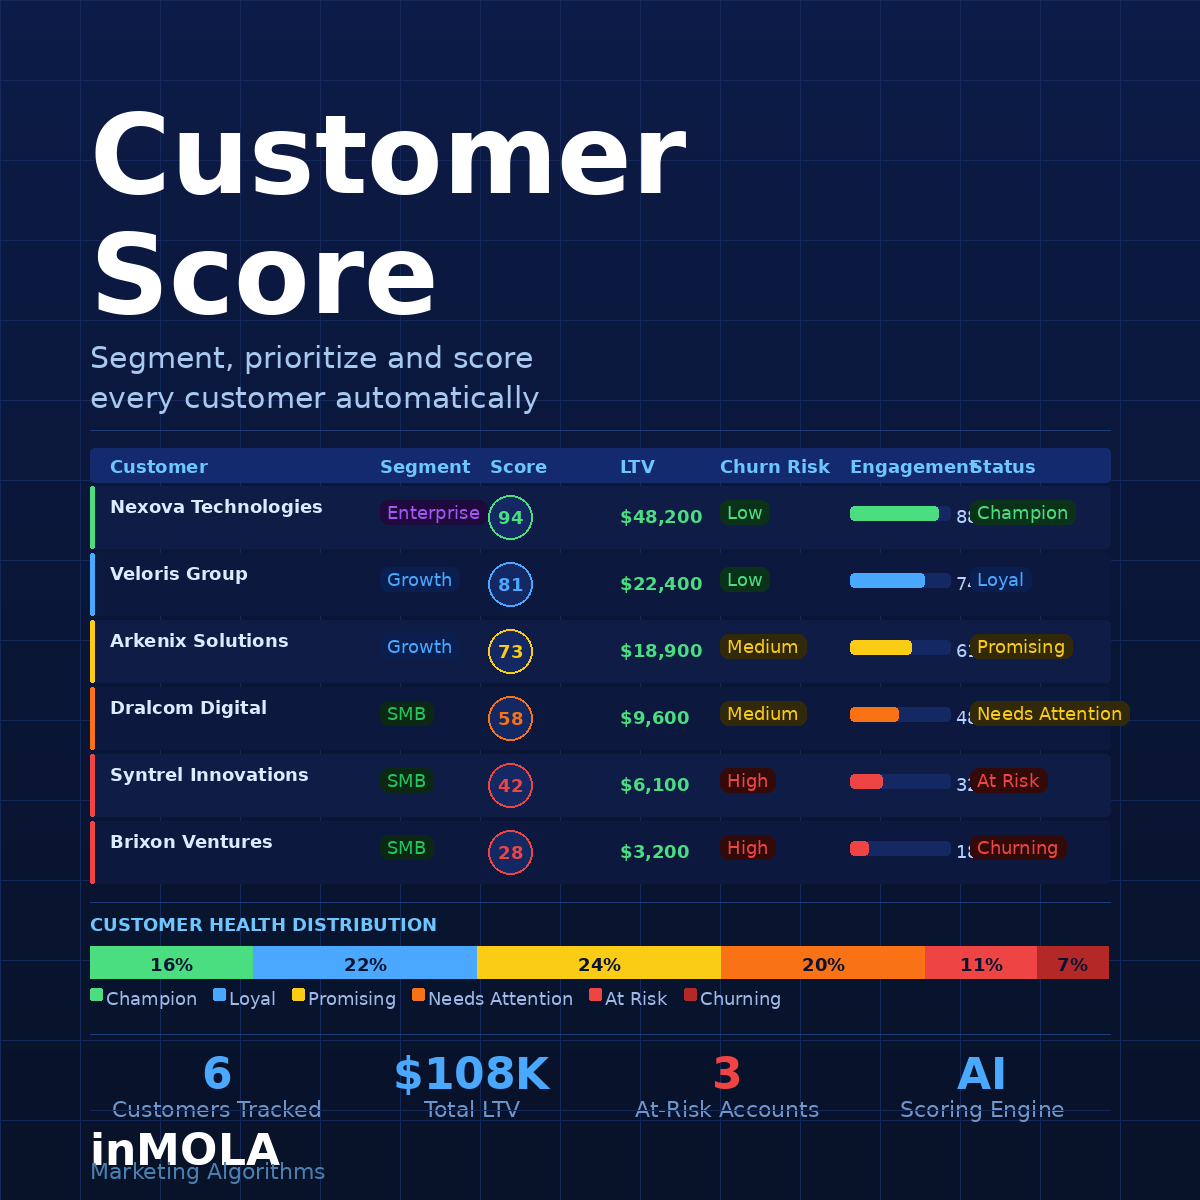
Customer Score
Customer Score transforms your entire customer base into a prioritized, AI-scored portfolio. Every customer is automatically evaluated across engagement signals, purchase behavior, digital authority, and relationship depth — producing a single score that tells your team exactly who to focus on, who to nurture, and who is quietly moving toward the exit. No more guesswork about which accounts deserve your attention this quarter.
Beyond individual scores, Customer Score segments your portfolio into clear health categories — from Champions and Loyal customers to At-Risk and Churning accounts — so your sales and marketing teams always know the state of every relationship at a glance. With real-time LTV tracking, churn risk alerts, and AI-generated action recommendations for each segment, it turns customer data into a proactive retention and growth engine rather than a lagging indicator of what already went wrong.

24.000+
Lines of Code

40+
inMOLA Modules

10.000+
Advice Comments

10+
Multi Languages
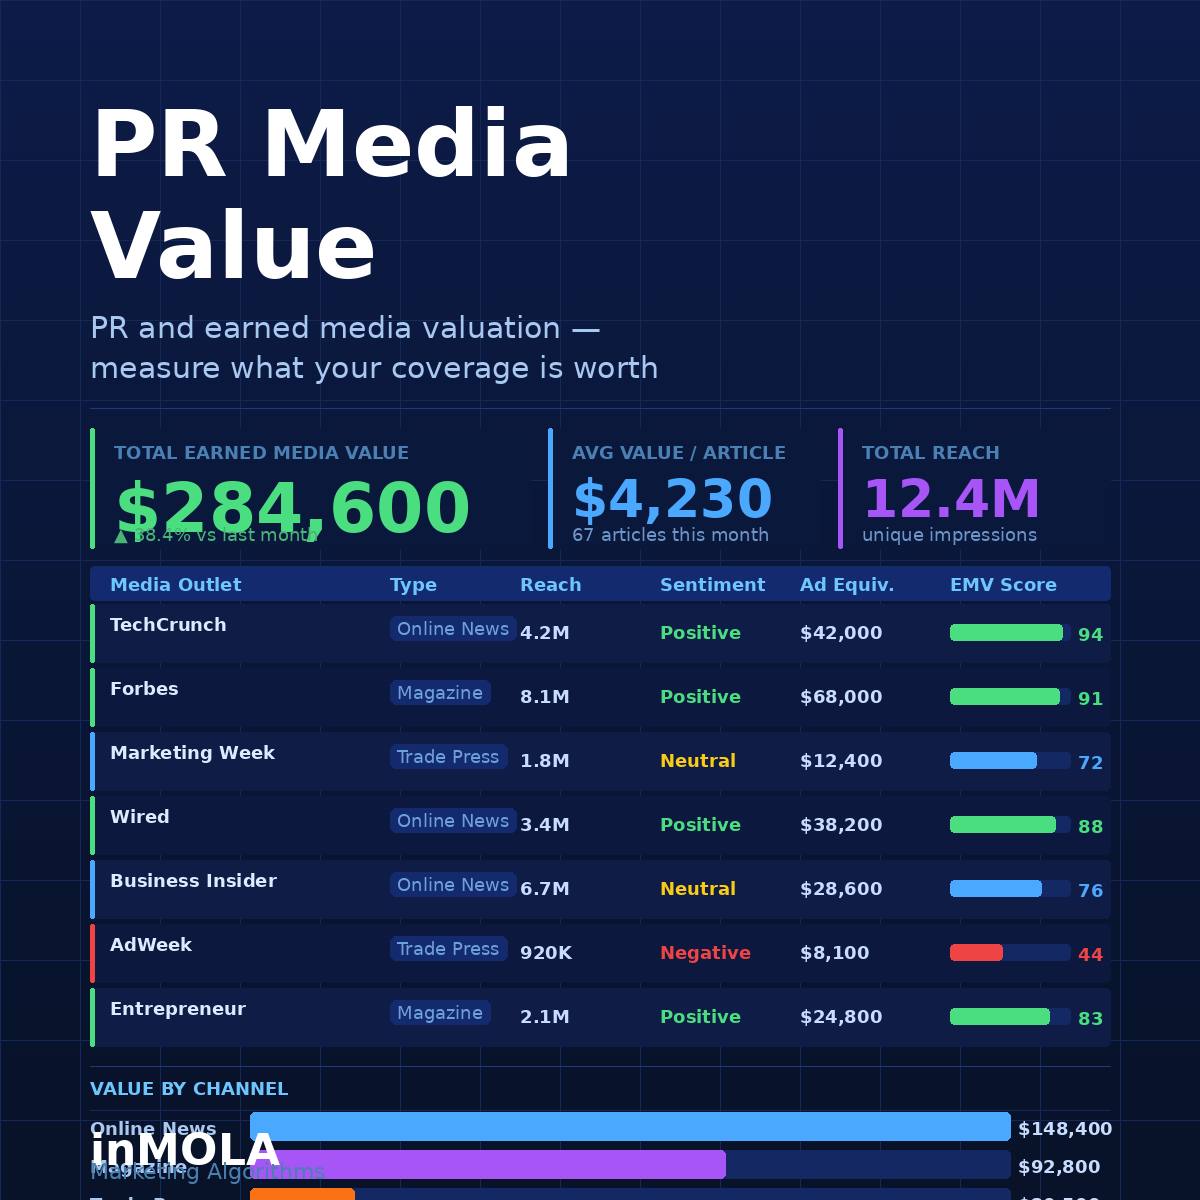
PR Media Value
PR Media Value quantifies the real impact of your digital PR and earned media efforts by translating coverage into a measurable business value. It evaluates not just volume, but reach, credibility, sentiment, and visibility to show how public relations contributes to brand awareness and authority.
By tracking PR performance alongside marketing and digital metrics, the PR Media Value tool reveals how earned media amplifies traffic, trust, and growth. This allows teams to treat PR as a strategic performance channel — not a soft metric — and align communication efforts with measurable outcomes.
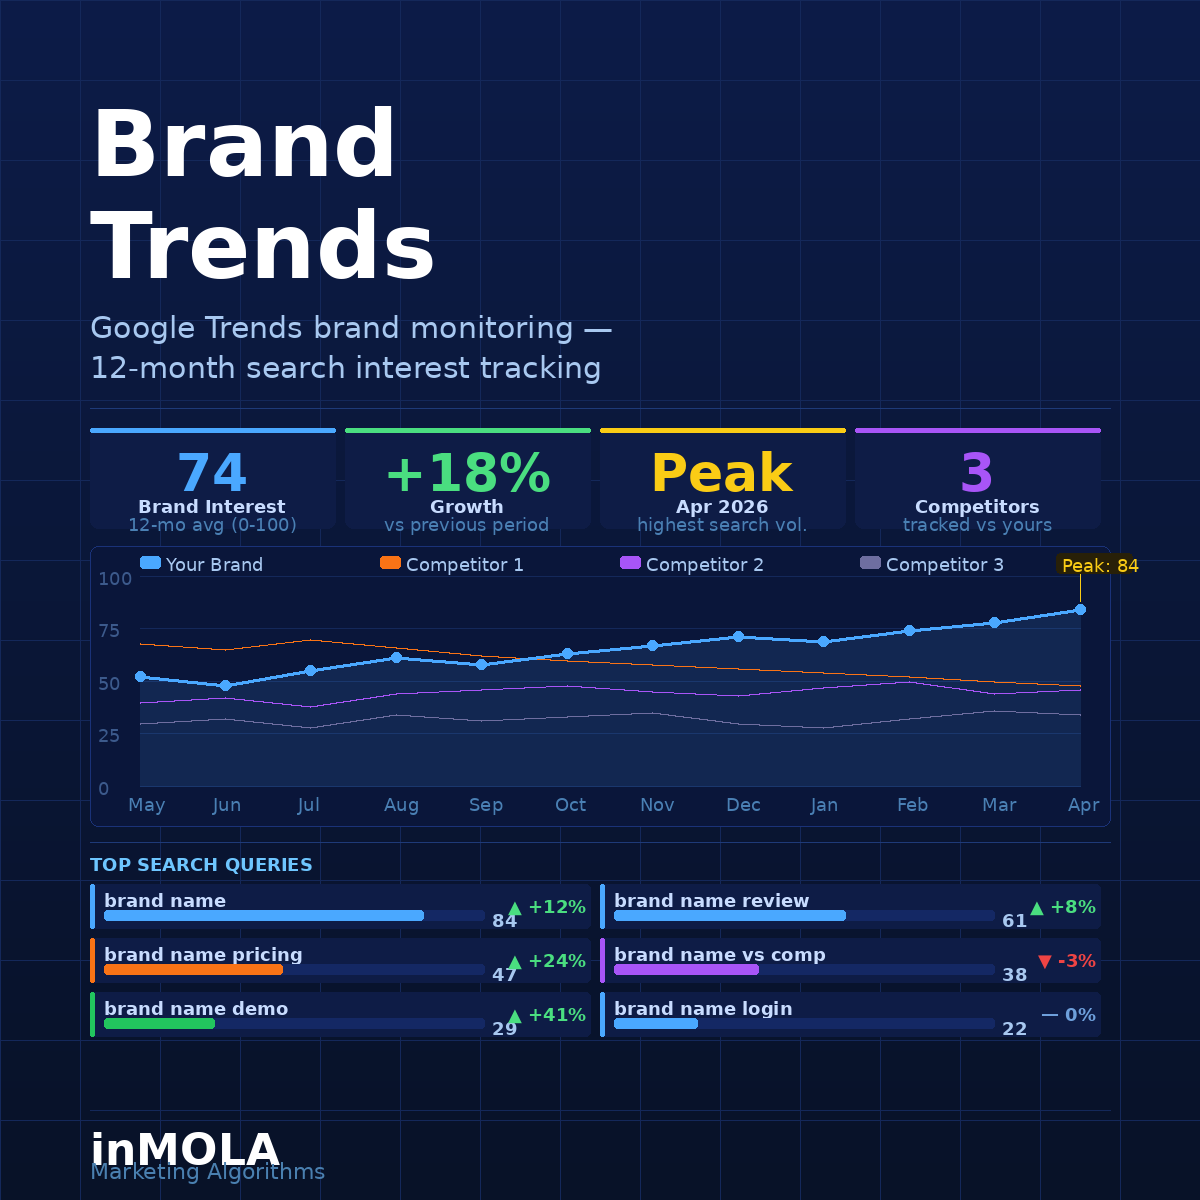
Brand Trends
Brand Trends tracks how your brand’s visibility, perception, and momentum evolve over time across digital channels and media. By monitoring changes in awareness signals, engagement patterns, search interest, and PR activity, it reveals whether your brand is gaining strength or losing ground.
Rather than isolated snapshots, Brand Trends focuses on direction and consistency. It helps teams detect early shifts in brand health, understand the drivers behind those changes, and adjust strategy before trends turn into long-term advantages or risks.
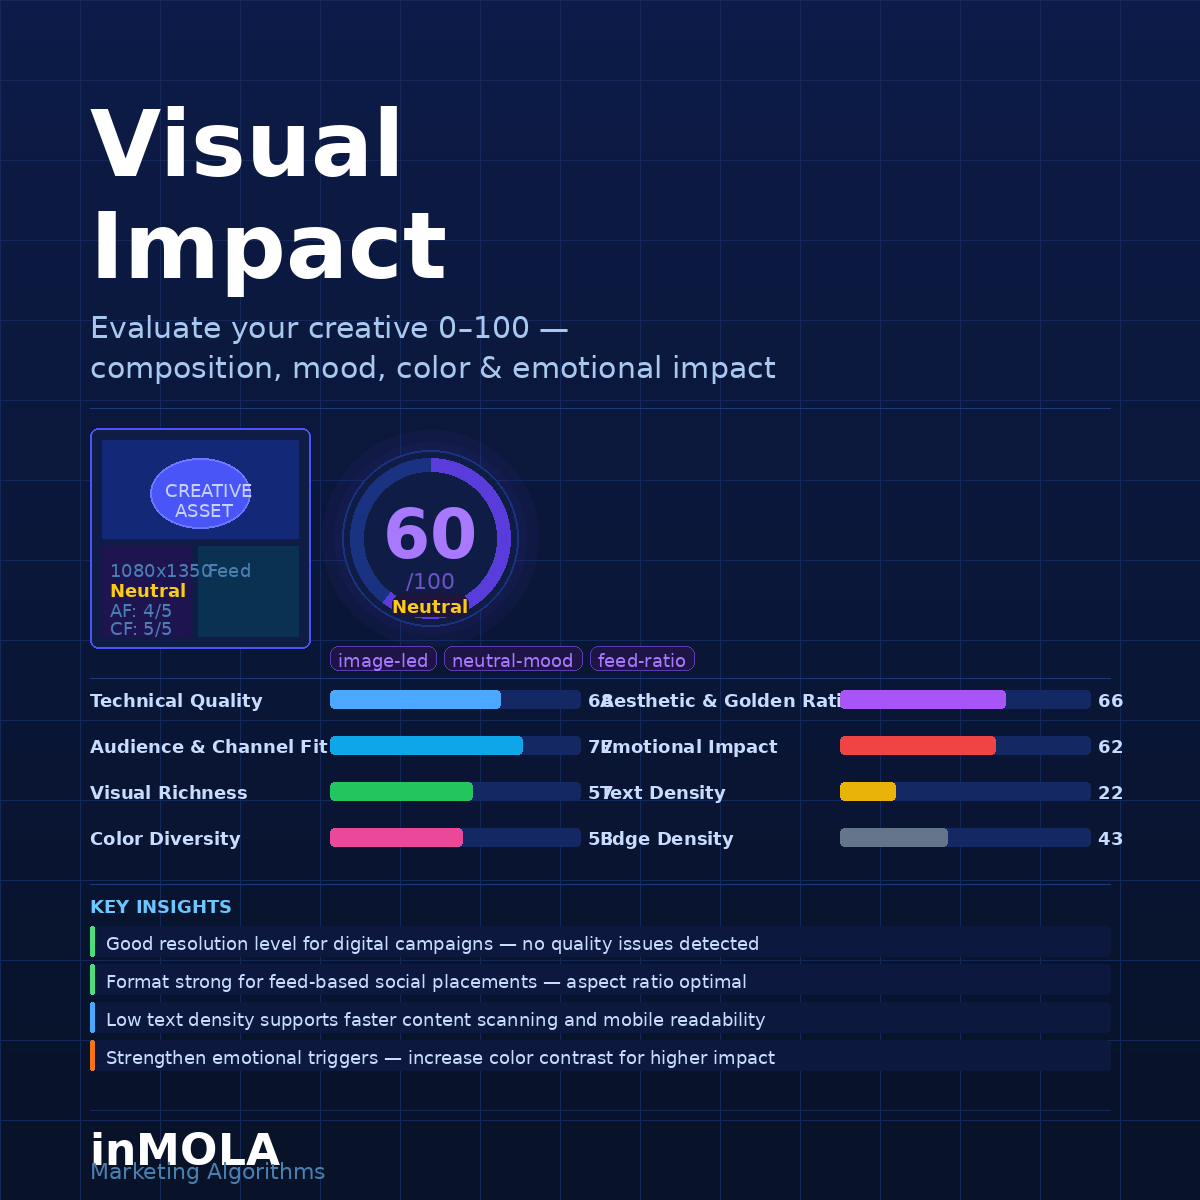
Visual Impact Score
Visual Impact Score measures how strongly your brand’s visual assets capture attention and drive engagement across digital channels. It evaluates the effectiveness of creative formats, design consistency, and visual resonance to show how well your visuals support brand recognition and performance.
By analysing interaction patterns and comparative visual performance, Visual Impact Score reveals which creatives amplify reach and influence behavior. This helps teams optimise design decisions, strengthen visual identity, and turn aesthetics into a measurable growth driver rather than a subjective judgment.
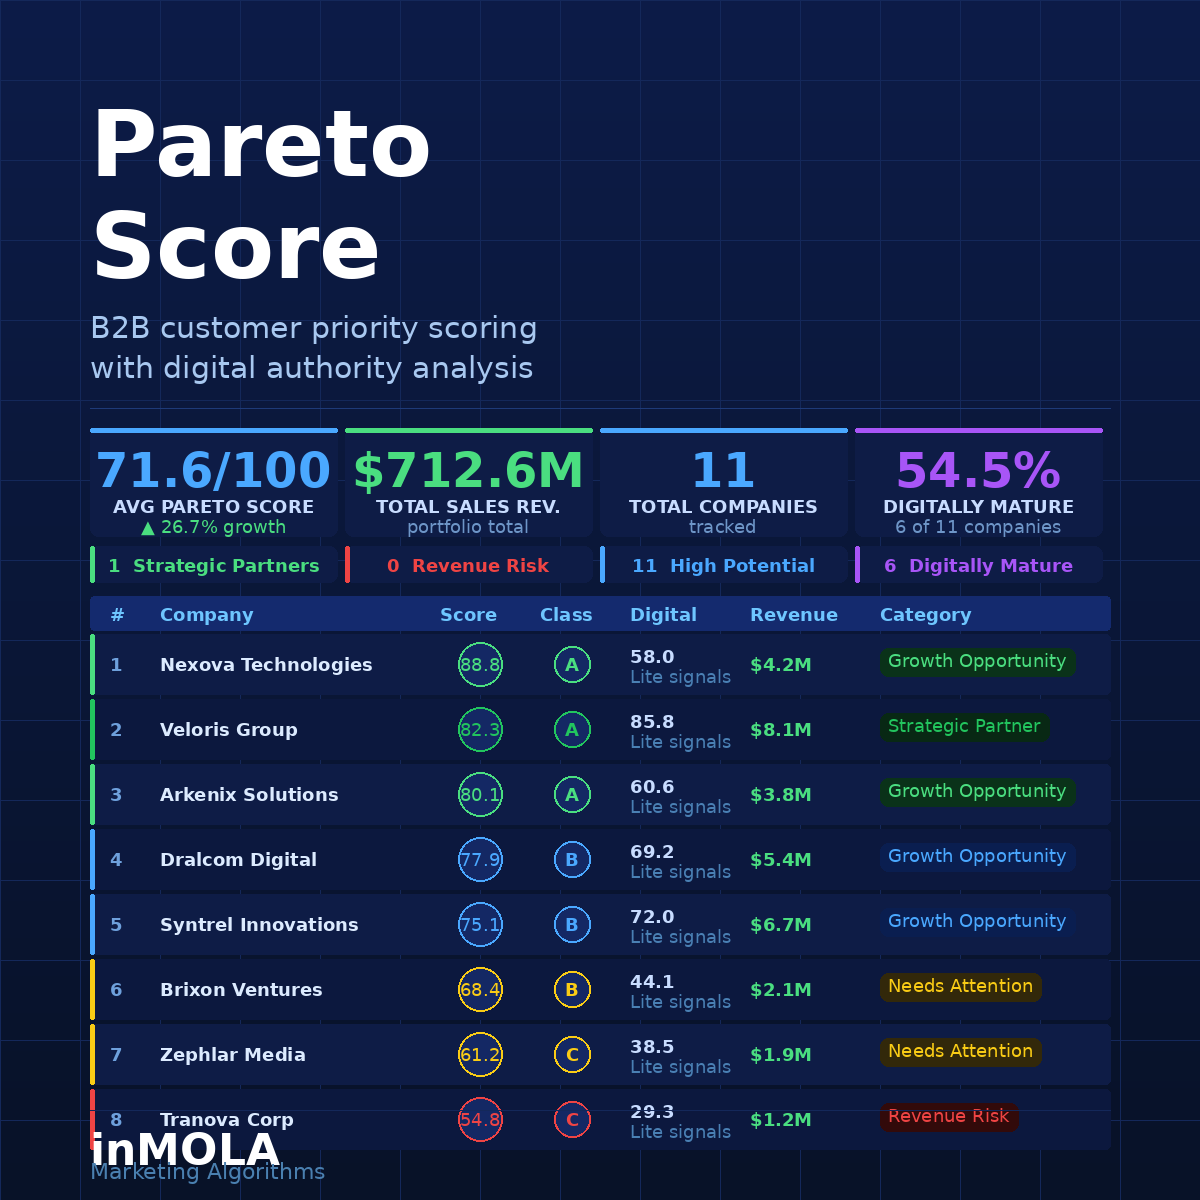
Pareto Score
Pareto Score applies the 80/20 principle to your B2B customer portfolio — identifying the companies most likely to drive the majority of your revenue, so your sales and marketing teams focus their energy where it matters most. Each company is scored and classified from A to C based on a combination of firmographic data, digital authority signals, and behavioral indicators, giving you a clear, ranked view of your most valuable relationships and your highest-potential growth opportunities.
Beyond scoring, Pareto Score tracks total portfolio revenue, digital maturity levels, and strategic partner status — turning a complex customer base into a prioritized action list. Whether you're allocating account management resources, planning outreach campaigns, or identifying churn risks before they escalate, Pareto Score ensures your team always knows which companies deserve the most attention, and which relationships have the highest ceiling for growth.

Marketing Security
Marketing Security evaluates how secure, compliant, and trustworthy your digital marketing infrastructure is from a brand and performance perspective. It measures factors such as HTTPS usage, security headers, domain configuration, data exposure risks, and technical trust signals that directly affect user confidence and conversion.
By identifying vulnerabilities and weak trust indicators, Marketing Security helps teams reduce reputational risk and prevent performance loss caused by technical or security gaps. It ensures that growth efforts are built on a stable, credible foundation where marketing impact is not undermined by avoidable security issues.